Performance Test - Why and How (feat. Locust & Spring Boot)
In Coming
Today I want to talk about something that is close to a required skill for any server developer — performance testing.
Once you spend some time doing this job for real, you keep running into the same question: how much traffic can the application server I just built actually take? It is surprisingly hard to answer by looking at the code, so you run a performance test to find out.
In this post we will build a tiny Spring Boot application server and put some load on it.
Why Performance Test?
Let’s start with the why. There are a few different reasons you would run one:
- To measure how many concurrent requests a single application server instance can handle, so you can prepare for traffic spikes.
- To compare before/after when you introduce or swap out a library, and confirm nothing regressed.
- To find optimization opportunities in a server that is already in production — usually together with an APM (Application Performance Monitoring) tool.
So the targets are either:
- an application server being deployed to production for the first time, or
- an application server that is already running in production
and the goal is the same in both cases: measure where you are now, and get to something better.
There is not much more to say about the why, so let’s get to the interesting part.
How to Performance Test
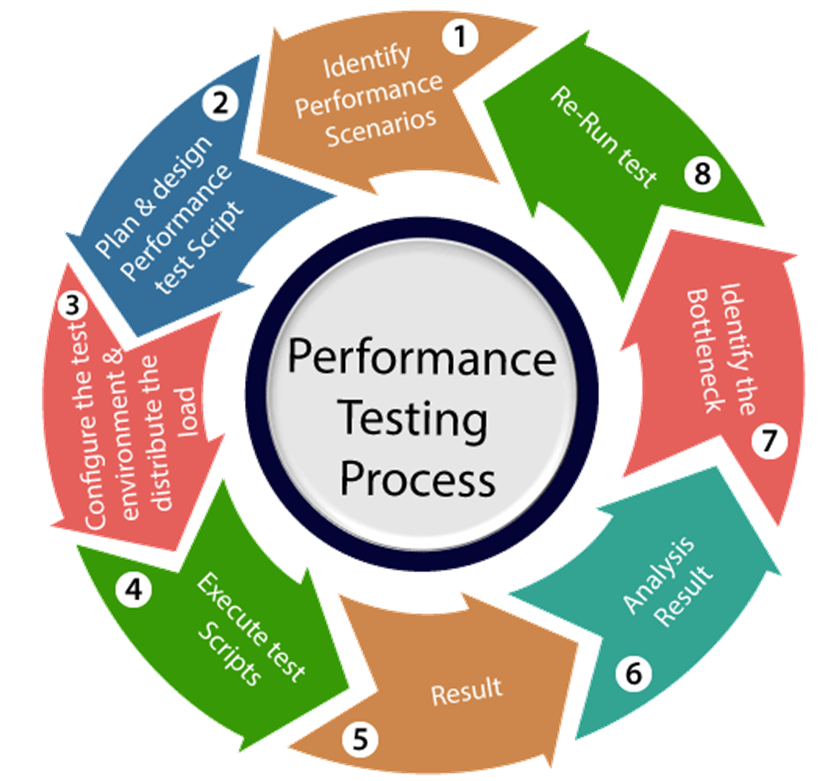 Performance Test life cycle
A performance test usually follows a fixed set of steps:
- Define the performance test scenario.
- Design and develop the performance test script.
- Build the performance test environment and acquire the infra resources that will generate the load.
- Run the performance test script.
- Write up the results.
- Analyze the results.
- Find and define the bottleneck.
- Repeat the test.
It looks simple written out like that, but it rarely is.
The theory is easy enough — the real question is what you need to have ready before you start:
- Application server
- Performance test script
- Performance test infra
- Performance test scenario
Those four are the essentials.
For the application server we will use Spring Boot, since that is what most of the Java/Kotlin world runs on.
The test solutions, though, are a wide field. Let me walk through the ones that come up most often so you can pick whichever fits your situation.
1. Locust
Locust is the representative performance test solution of the Python world.
When you build the infra for a performance test, the workers running the script need enough horsepower of their own — otherwise the load generator becomes the bottleneck instead of your server. Locust uses a master–slave architecture, so you can package it as a Docker image and scale the workers out on Kubernetes without much trouble.
It is open source, so there is no cost constraint.
| Feature | Supported |
|---|---|
| GUI Tool | Yes |
| Warm up | Yes |
| Chart | Yes |
| CSV Download | Yes |
2. K6
K6 is the representative performance test solution of the JavaScript world.
Like Locust, it is easy to run workers on Kubernetes, and its biggest strength is the sheer number of well-written examples in the official docs. The main downside: the bigger your scale gets, the more you will need the paid tier to keep things running smoothly.
| Feature | Supported |
|---|---|
| GUI Tool | Yes |
| Warm up | Yes |
| Chart | Yes |
| CSV Download | Yes |
3. nGrinder
nGrinder is a performance test solution built by Naver.
The catch is that building Kubernetes-based workers is poorly documented, which makes the infra setup harder than it should be. It also has not seen an additional release in quite a while.
On top of that, scripts are written in Groovy. You can write them on a Kotlin/Java/Python base, but you have to learn how to wire that up — so if Groovy is unfamiliar territory, expect some friction.
| Feature | Supported |
|---|---|
| GUI Tool | Yes |
| Warm up | Yes |
| Chart | Yes |
| CSV Download | Yes |
https://naver.github.io/ngrinder/
4. Others
There are plenty more — JMeter, Gatling, and so on. If none of the above fit, a roundup like Top 10 Performance Testing Tools is a good place to browse.
Which one you choose is up to you.
For this post I will go with Locust — I am comfortable with Python, and it does not require paying for anything.
Hands-on
Time to actually do it. One thing I am skipping: setting up the performance test infra.
I have no way of knowing which cloud solution (or self-hosted environment) you are on, and demonstrating it on AWS would bill me for the privilege.
Application server
Let’s write a simple Spring Boot application server.
Your real application server is almost certainly far more complex than this one.
1
2
3
4
5
6
7
8
9
10
11
12
13
14
15
16
17
18
19
20
21
22
23
24
25
26
27
28
29
30
31
32
33
package org.example.springbootmvc.controller

import org.slf4j.LoggerFactory
import org.springframework.http.ResponseEntity
import org.springframework.web.bind.annotation.GetMapping
import org.springframework.web.bind.annotation.PathVariable
import org.springframework.web.bind.annotation.RequestParam
import org.springframework.web.bind.annotation.RestController

@RestController
class TestController {
    private val log = LoggerFactory.getLogger(this::class.java)

    @GetMapping("/")
    fun entrypoint(): ResponseEntity<Map<String, String>> {
        log.info("HTTP / received")
        return ResponseEntity.ok(mapOf("Hello" to "world"))
    }

    @GetMapping("/items/{item_id}")
    fun readItem(
        @PathVariable("item_id") itemId: Long,
        @RequestParam("query_param", required = false) queryParam: String,
    ): ResponseEntity<Map<String, Any>> {
        log.info("HTTP /items/${itemId} received")
        return ResponseEntity.ok(
            mapOf(
                "itemId" to itemId,
                "queryParam" to queryParam
            )
        )
    }
}
There are two APIs we want to test:
GET /GET /items/{item_id}
Now let’s go write the performance test script.
Performance test script
The test script is Locust-based. For the syntax details, see the Locust documentation.
1
2
3
4
5
6
7
8
9
10
11
12
13
14
15
16
import random

from locust import HttpUser, task, tag


class PerformanceTest(HttpUser):
    @tag("entry_point")
    @task
    def entry_point(self):
        self.client.get(url="/")

    @tag("read_item")
    @task
    def read_item(self):
        item_id = random.randint(1, 100_000)
        self.client.get(url=f"/items/{item_id}", params={"query_param": "test"}, name="/items/{item_id}")
A short script, with each of the two APIs defined as its own function.
Note the name parameter on the second request — without it, every randomized item_id would show up as a separate row in the statistics.
Performance test execute
First, let’s run the application server locally.
 8080 port
It is configured to come up on port 8080.
Now, shall we run the performance test script?
1
pip install locust
We install Locust through pip first.
Running it after that is simple.
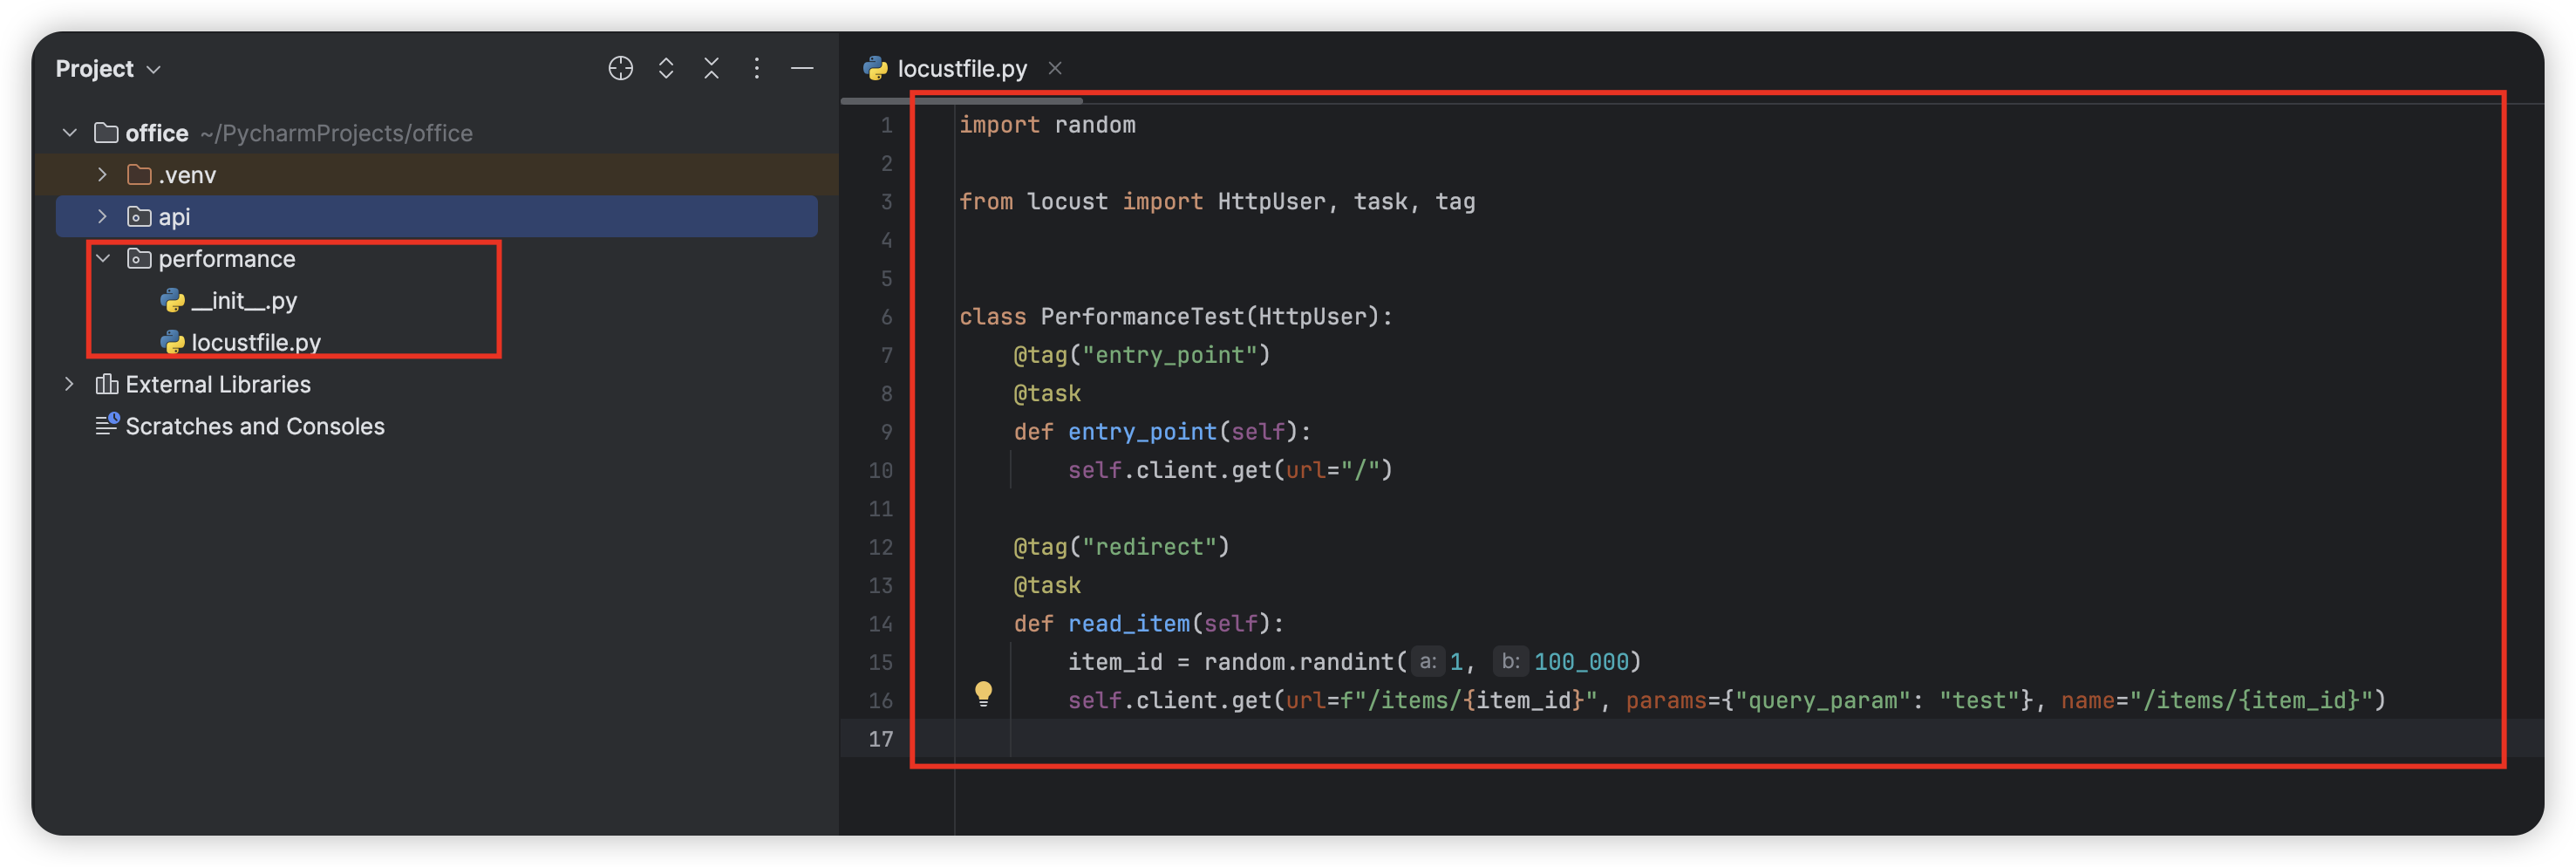 locustfile.py
A Python file named locustfile.py becomes the entry point — you define which APIs to hit, and under which scenario, as functions.
 locust command
Run the locust command and a GUI for driving the performance test script comes up on port 8089.
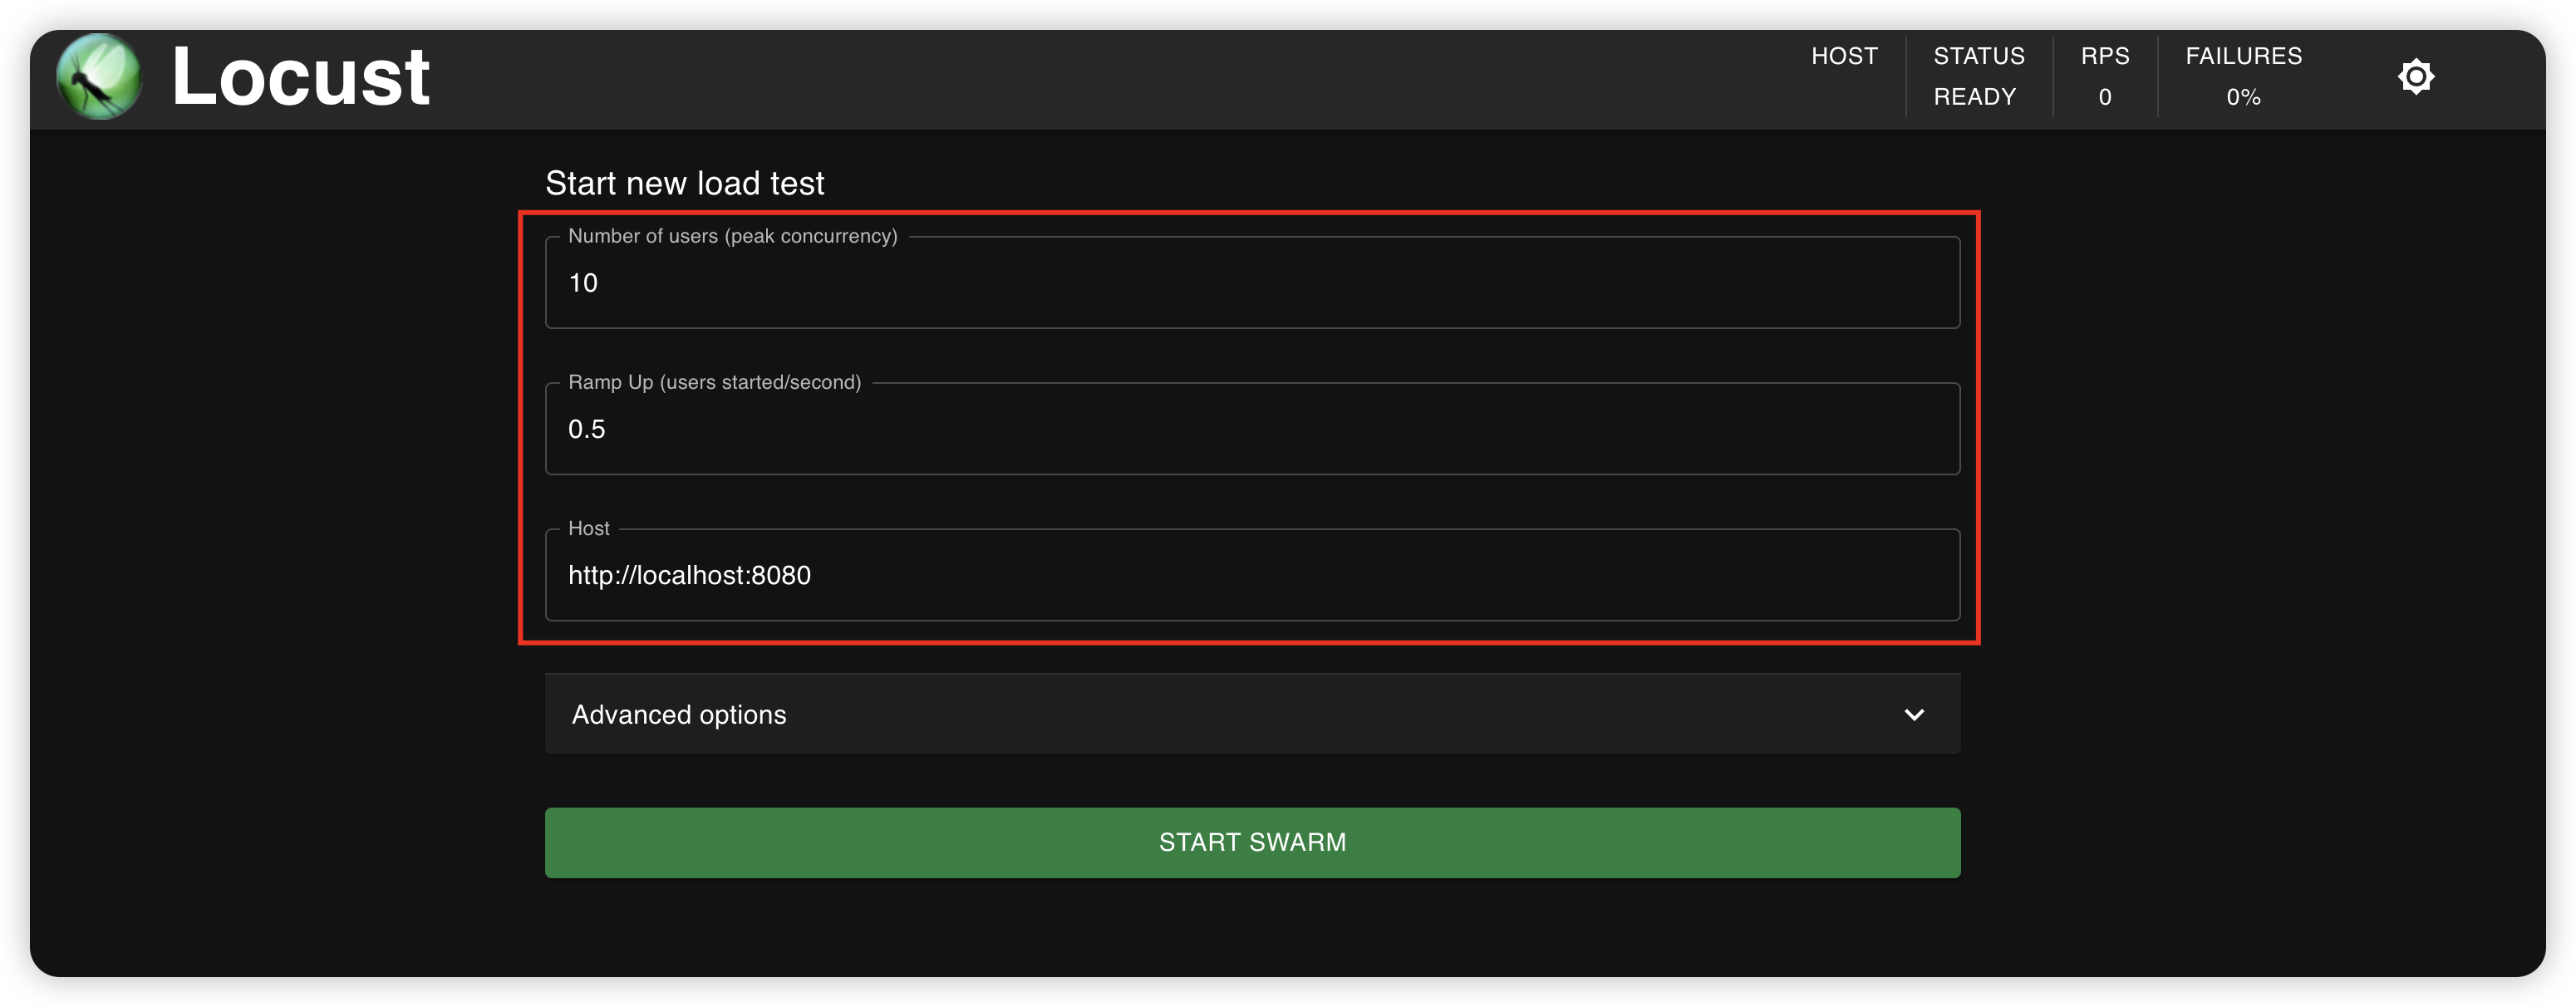 Locust start form
Define the number of users, specify the ramp-up rate, write down the host URL you want to test against — and that is the whole setup.
Shall we give it a go?
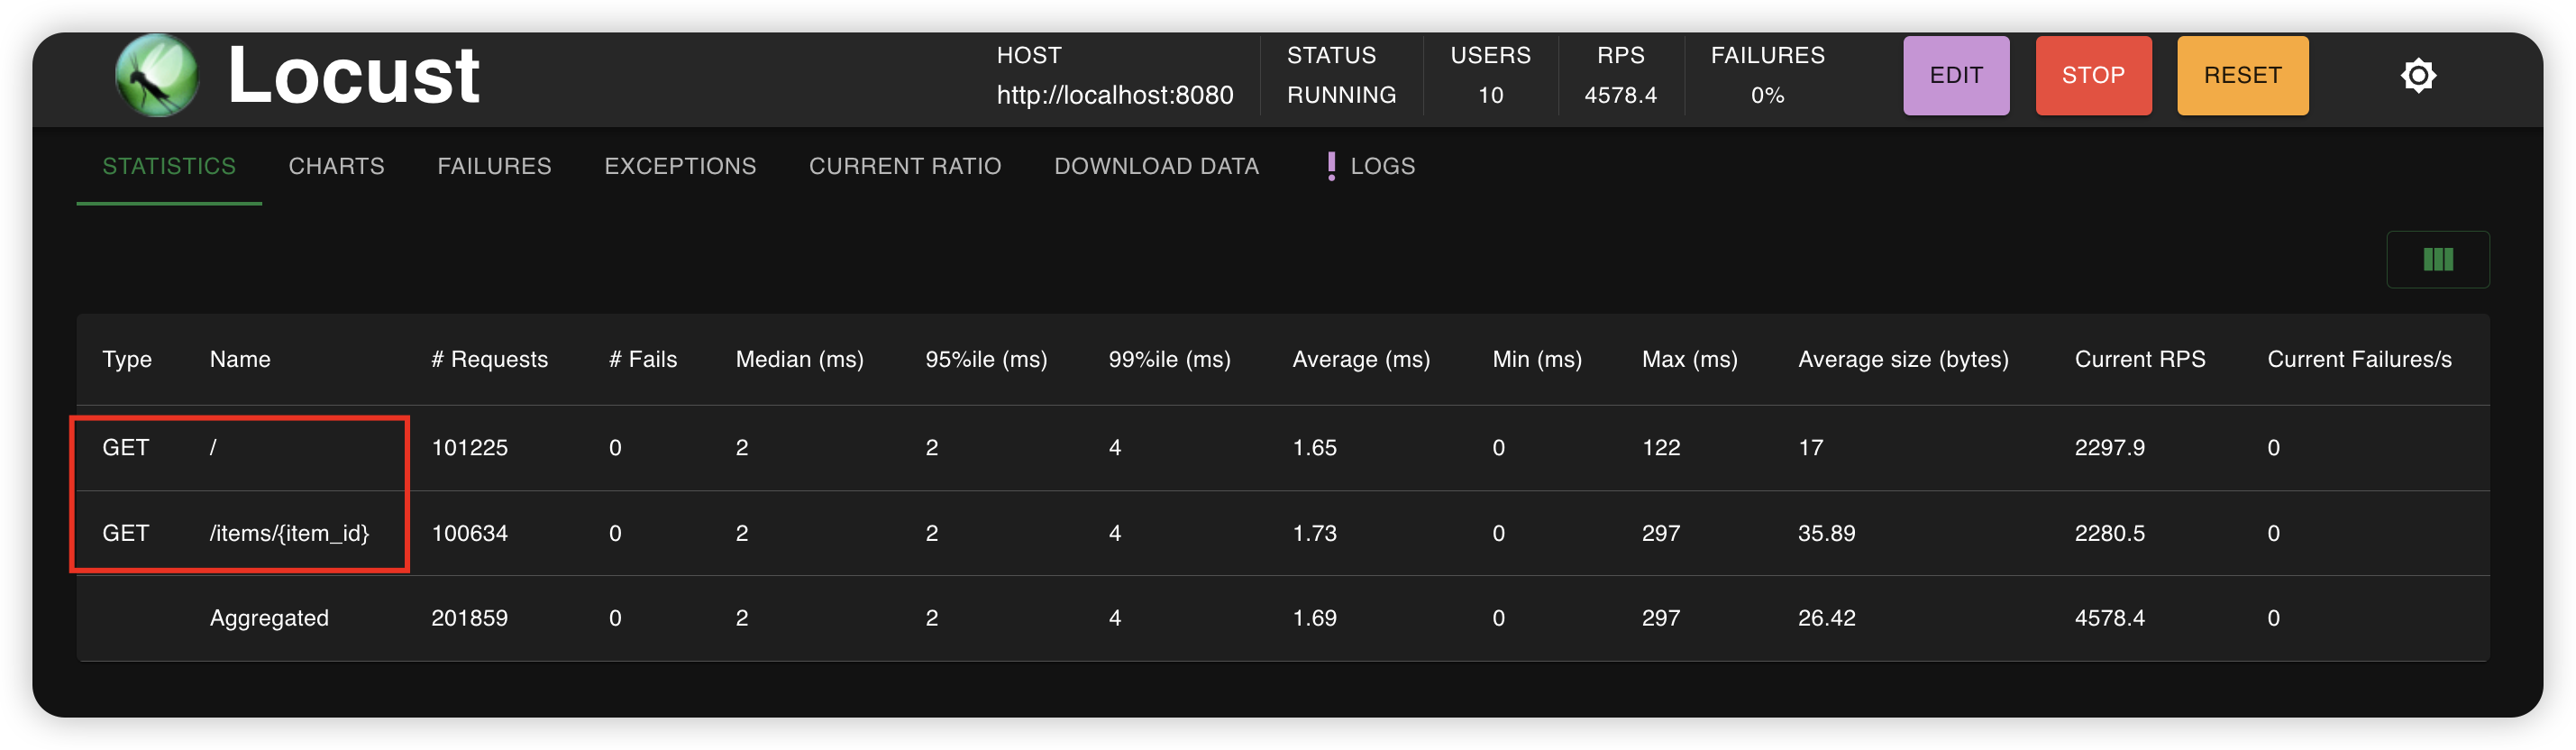 Locust statistics
You get request counts and response times (average, 95%, min, max) broken down per API.
And if you click Chart..!
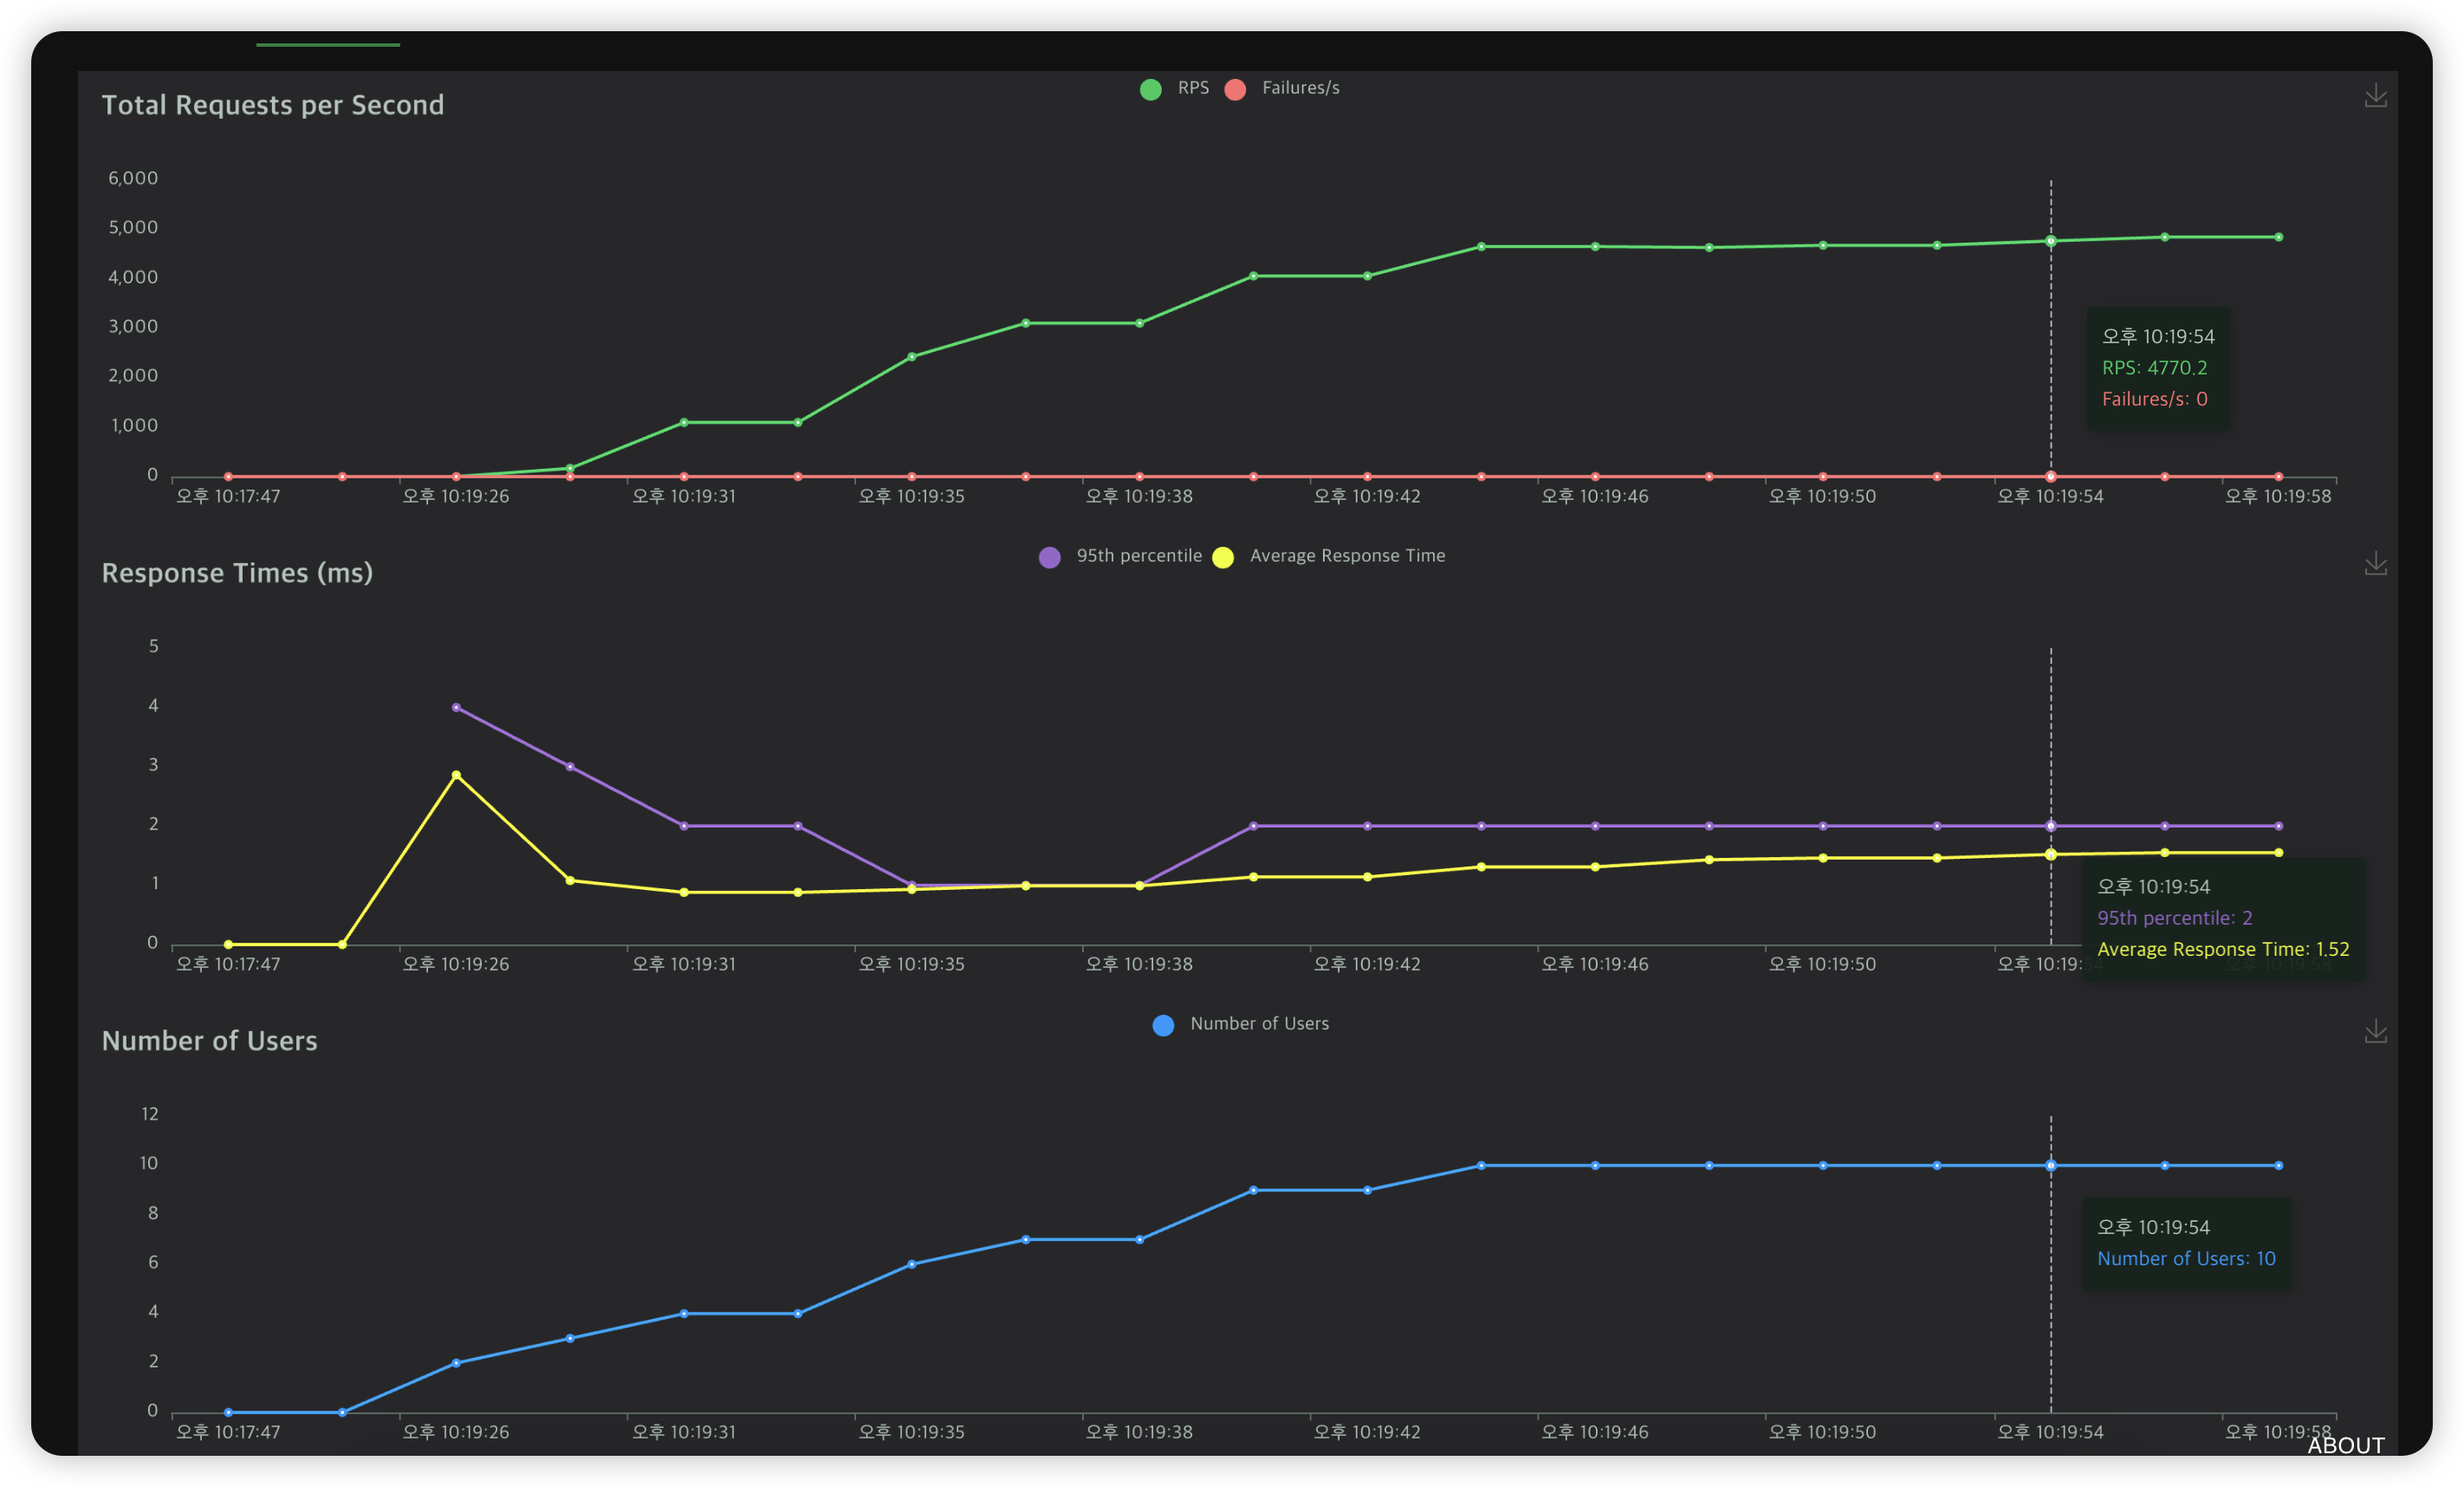 Users and requests grow gradually according to the warm-up rate
You can watch the load ramp up gradually, following the warm-up rate we specified at start time.
Let’s check the application log to confirm the load is really landing.
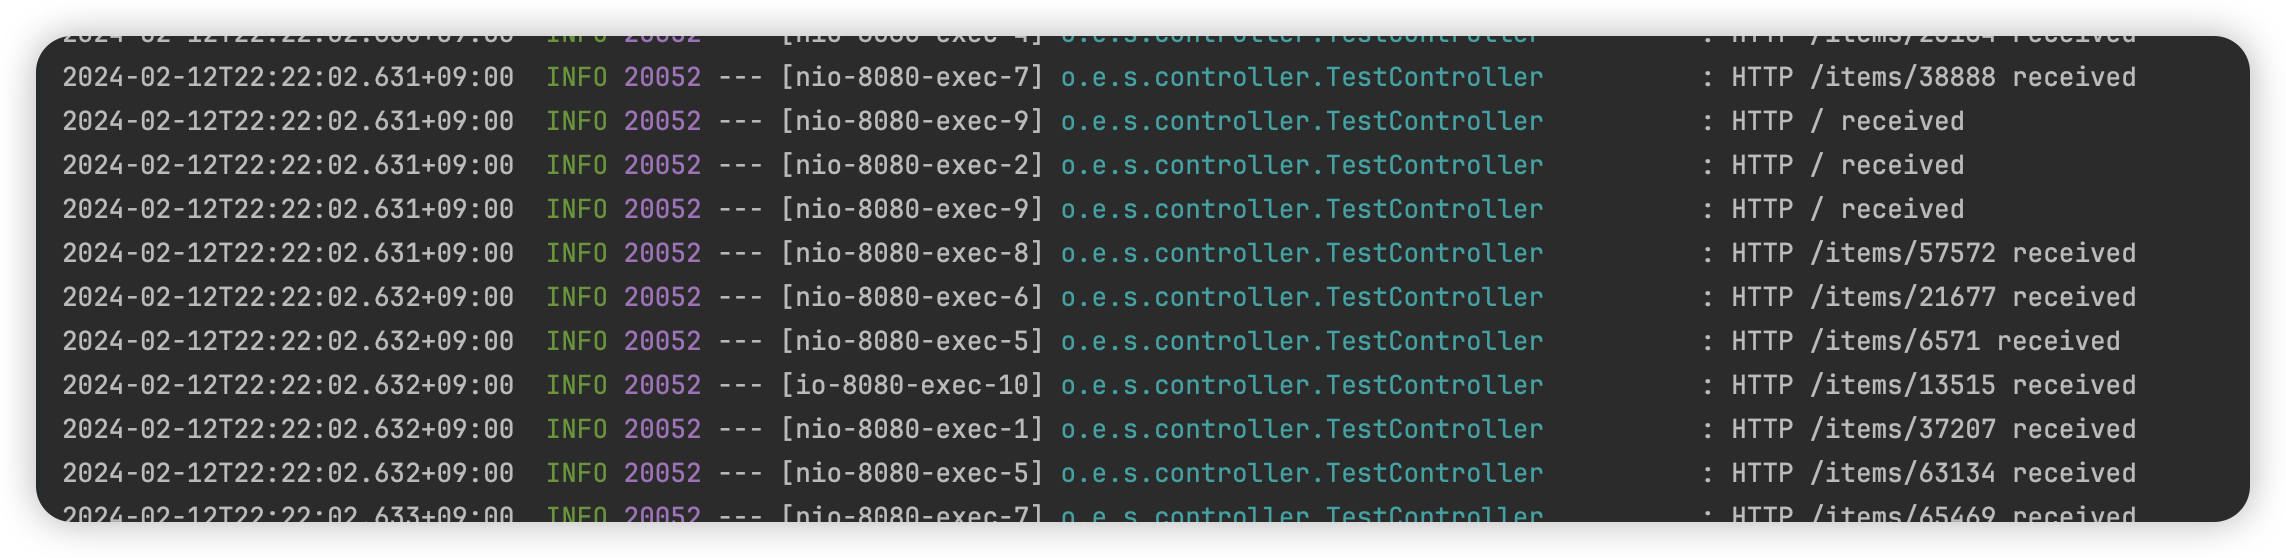 Application server log
Being a performance test, request logs are piling up at a ferocious rate.
Performance test Analysis
And that is a simple hands-on run.
One caveat: this ran in a local environment, so the results are bounded by the performance of my local PC.
When you test in a real environment, keep an eye on how much CPU and memory the application server you are deploying actually has. The numbers you get — RPS, response time — will differ depending on those specs.
So the right approach in a real environment is to first find the limit your application server can take, then change conditions around that limit and re-test.
Changing even a single condition can swing the results dramatically, so constrain yourself to one variable at a time. It makes analyzing and writing up the results enormously easier.
Wrap Up
Today we looked at why you should run performance tests and how to actually do it. A quick summary:
- Always work out what you need to prepare up front — server, script, scenario, infra.
- Evaluate the performance test solutions and pick the one that best fits your own environment.
- When you test, change exactly one condition at a time.
Hopefully performance testing feels a little less intimidating from here on.