Observability - Concepts with Grafana Examples (feat. Prometheus, Tempo, Loki)
Background
Today, let’s talk about Observability.
Monitoring
Most of you have probably heard of the term “Monitoring.” The reason teams build monitoring systems is to check the state of their systems in real time.
Monitoring is tooling or a technical solution that allows teams to watch and understand the state of their systems. Monitoring is based on gathering predefined sets of metrics or logs.
Monitoring has long been an essential element for managing systems, and teams have always invested in building it.
However, as complex requirements grew and teams sought to minimize inter-system dependencies, Microservice Architecture (MSA) rose to prominence. Organizations began splitting teams to maximize the advantages of MSA.
In this environment, the number of microservices started growing exponentially, making operations and debugging increasingly difficult.
As a result, the traditional approach of monitoring based solely on metrics and logs was no longer sufficient. When an issue occurs, it rarely involves just a single system — multiple systems interact in complex relationships.
This is where Observability entered the picture. So what exactly is it?
Observability is tooling or a technical solution that allows teams to actively debug their system. Observability is based on exploring properties and patterns not defined in advance.
Observability goes beyond simply showing error states like traditional monitoring. It aims to help you understand why an error occurred. In other words, observability doesn’t just detect errors and fire alerts — it provides every means necessary to find the root cause of a problem.
So how can we achieve observability in practice?
Observability
Achieving observability relies on three key pillars of data:
- Metric (Aggregatable): Numerical data measured over time intervals.
- Trace (Request-scoped): Data for tracking request flows. In MSA, this is called a Distributed Trace, distinguishing between Traces and Spans.
- Log (Events): Data that records application events.
You can think of these three pillars as being defined to serve the purposes noted in parentheses.
- Metrics are based on time-series data, making them ideal for aggregation over time intervals.
- Traces are based on trace context, making them ideal for per-request aggregation.
- Logs are free-form records of specific events, making them ideal for event-level analysis.
Each pillar has a representative storage backend:
- Metric: Prometheus
- Trace: Tempo
- Log: Loki
Since these pillars serve different responsibilities, finding a way to connect all three makes it much easier to identify the root cause of a problem.
To link these three pillars, you can establish Correlations between each pair.
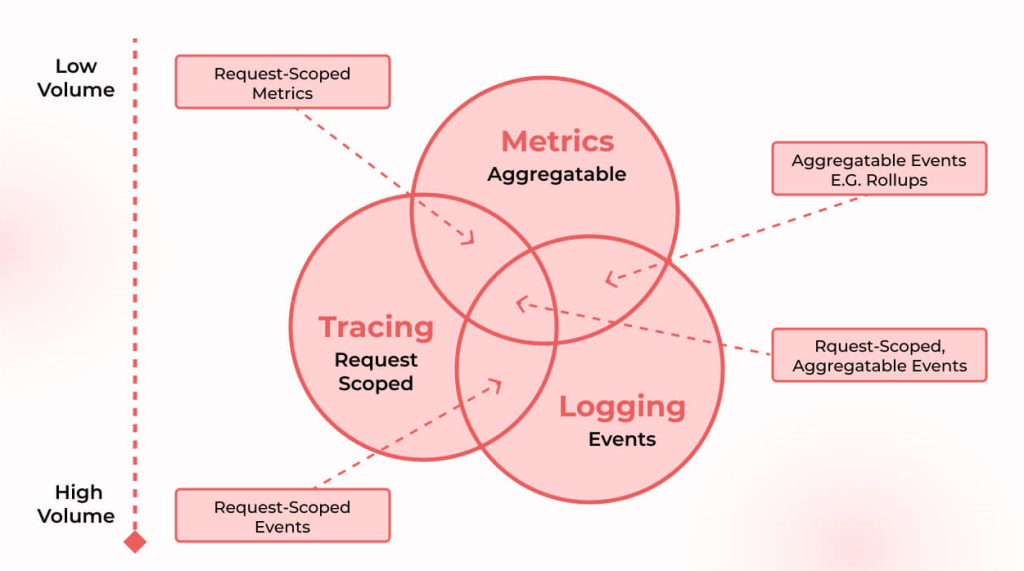
As shown in the diagram, Metric, Trace, and Log each play a distinct role. By leveraging the intersections between them, you can quickly pinpoint the cause of an error.
- Metric ↔ Trace: Connected via Exemplars — metric data linked to request-level trace representatives.
- Trace ↔ Log: Connected via TraceId / SpanId — request-level events correlated by trace context.
- Log ↔ Metric: Connected via Time period — events and metrics correlated by their timestamps.
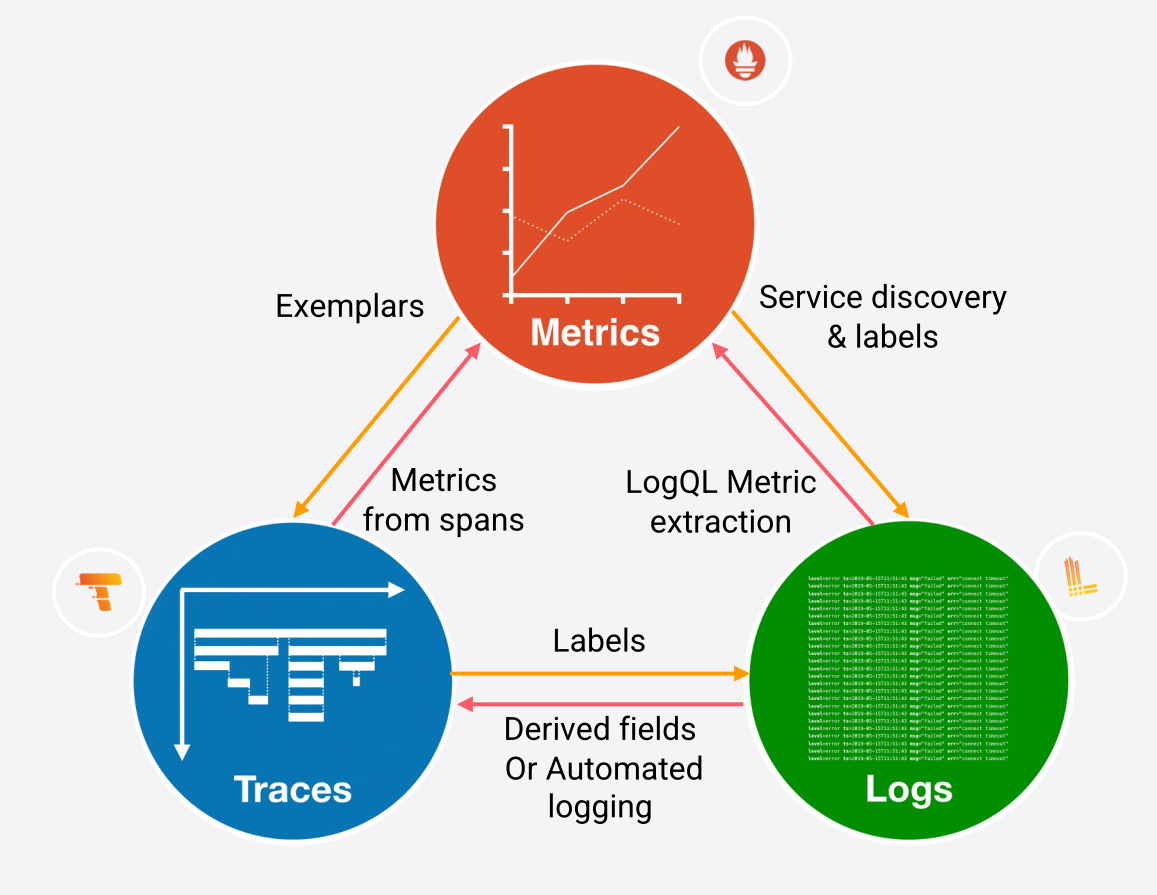
Once data collection with these correlations is in place, you can easily build dashboards using a visualization tool like Grafana and navigate seamlessly between each data type.
Correlation Examples
Metric ↔ Trace
As mentioned above, Metrics and Traces can be connected through Exemplars.
An Exemplar represents a metric measured over a given time period as trace representative data.
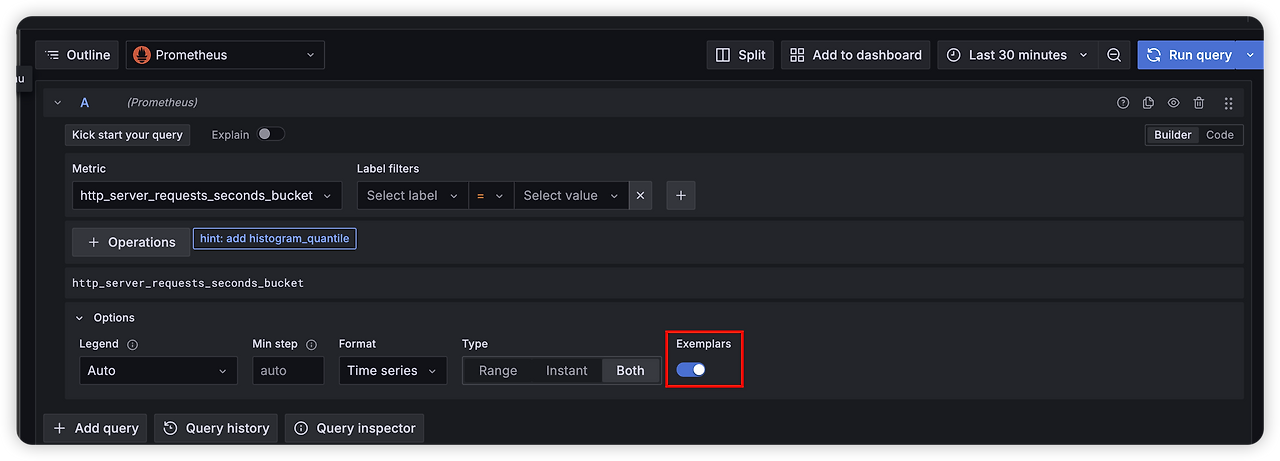
When you enable the Exemplar option in Grafana, you can see information like the following:
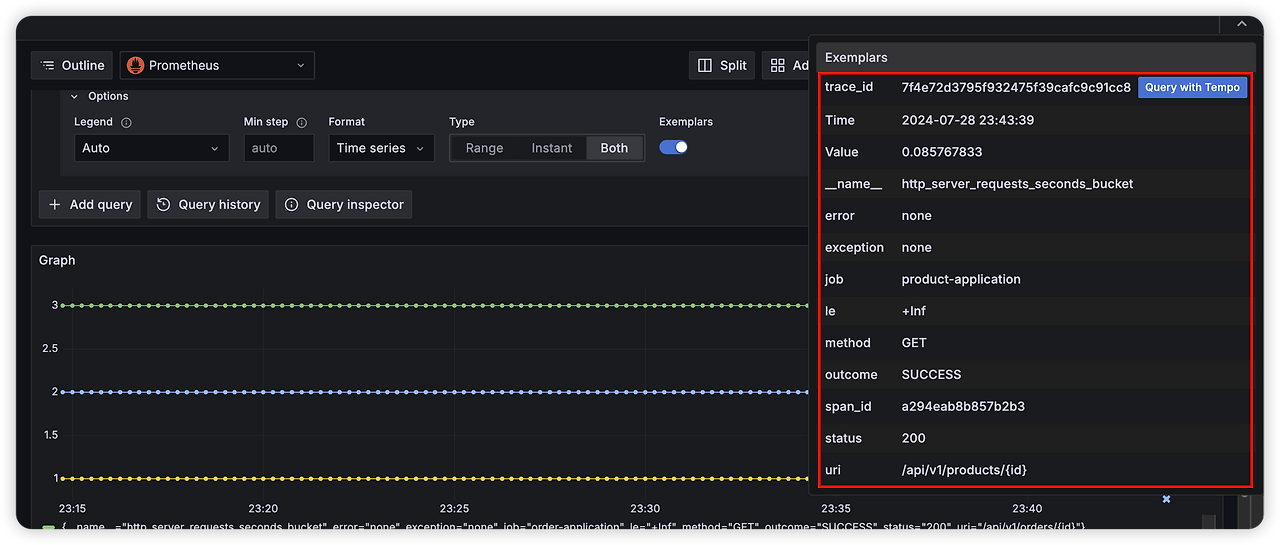
Through Exemplars, you can discover a traceId and use it to query the trace store (Tempo) directly.
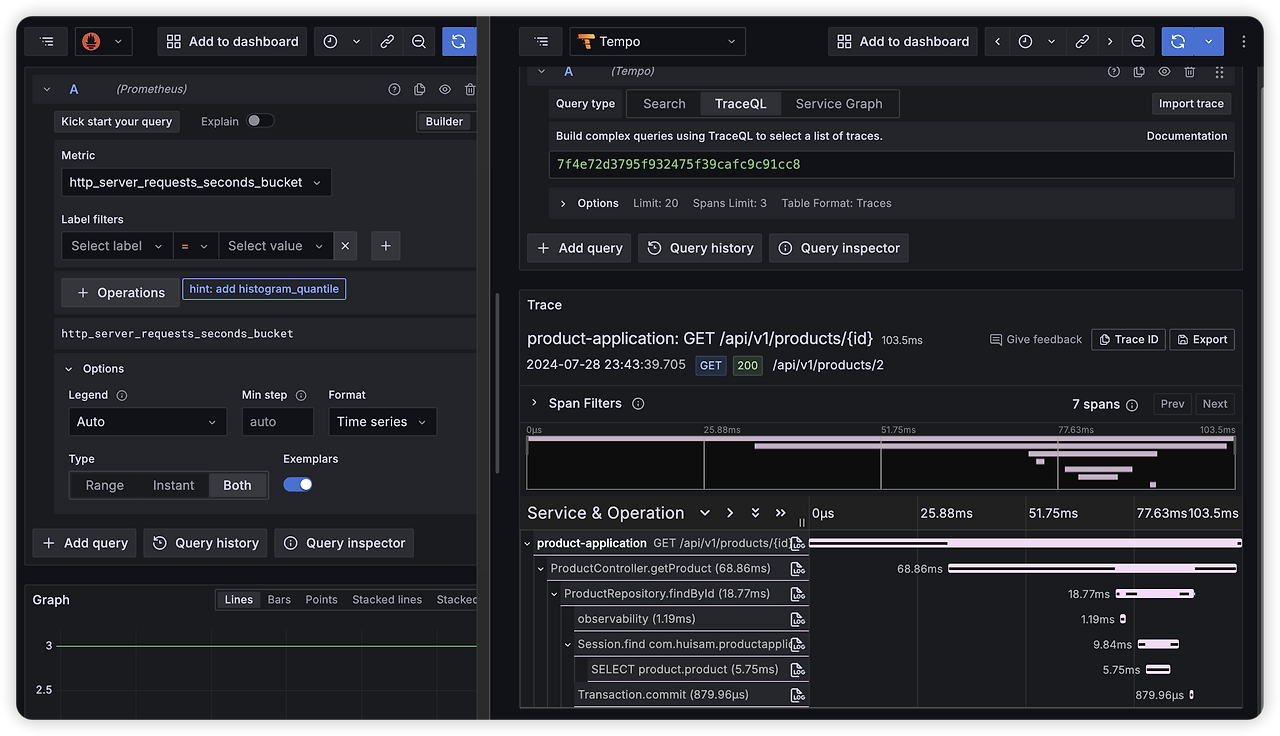
Clicking the link button automatically runs a query based on the traceId, letting you instantly see how the request flowed through the system.
Trace ↔ Log
How are Traces and Logs connected?
Traces and Logs are linked at the request level via traceId and spanId.
Think of it this way: a traceId is the scope for a specific request, and a spanId is the scope for a single method execution.
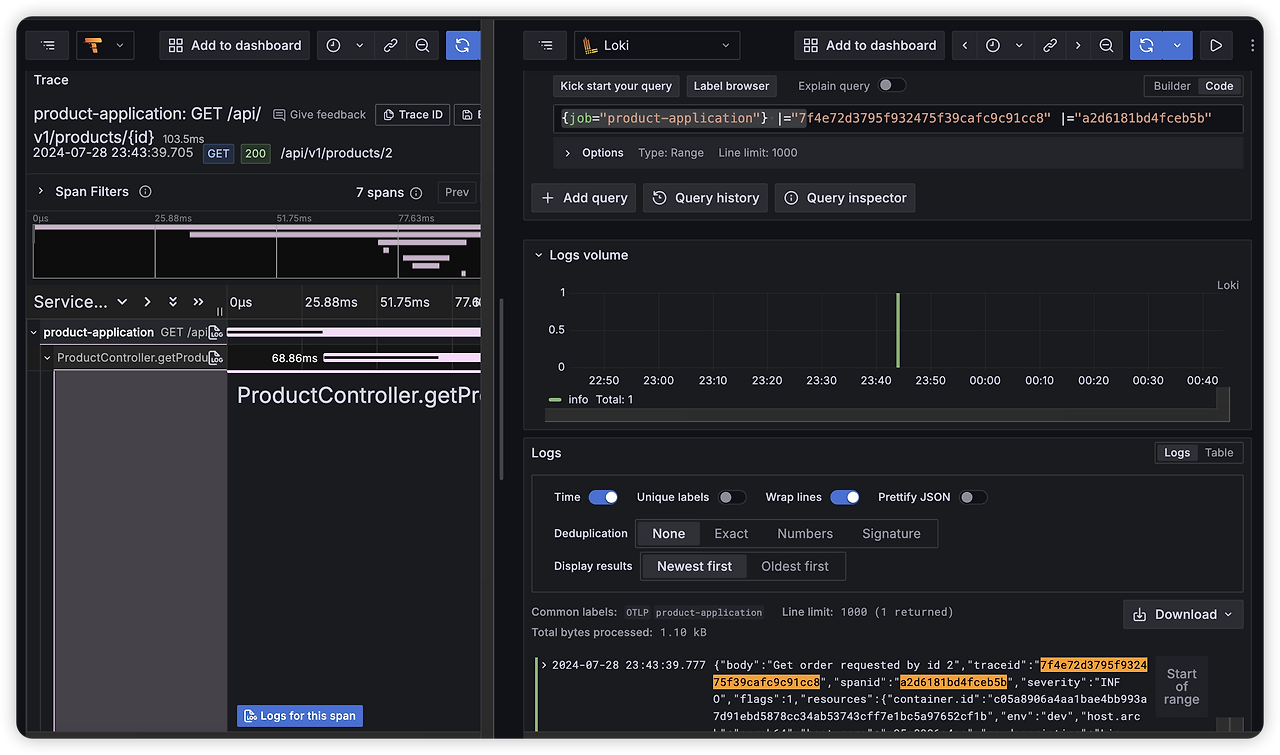
Clicking the link button auto-completes a query to the log store (Loki) based on the traceId and spanId, allowing you to view the logs for that specific span.
Log ↔ Metric
The element that connects Logs directly to Metrics is time. Unfortunately, Grafana doesn’t currently offer a direct navigation path from logs to metrics, so you need to identify the time window through traces.
You can start from the Service Graph, which visualizes function execution:
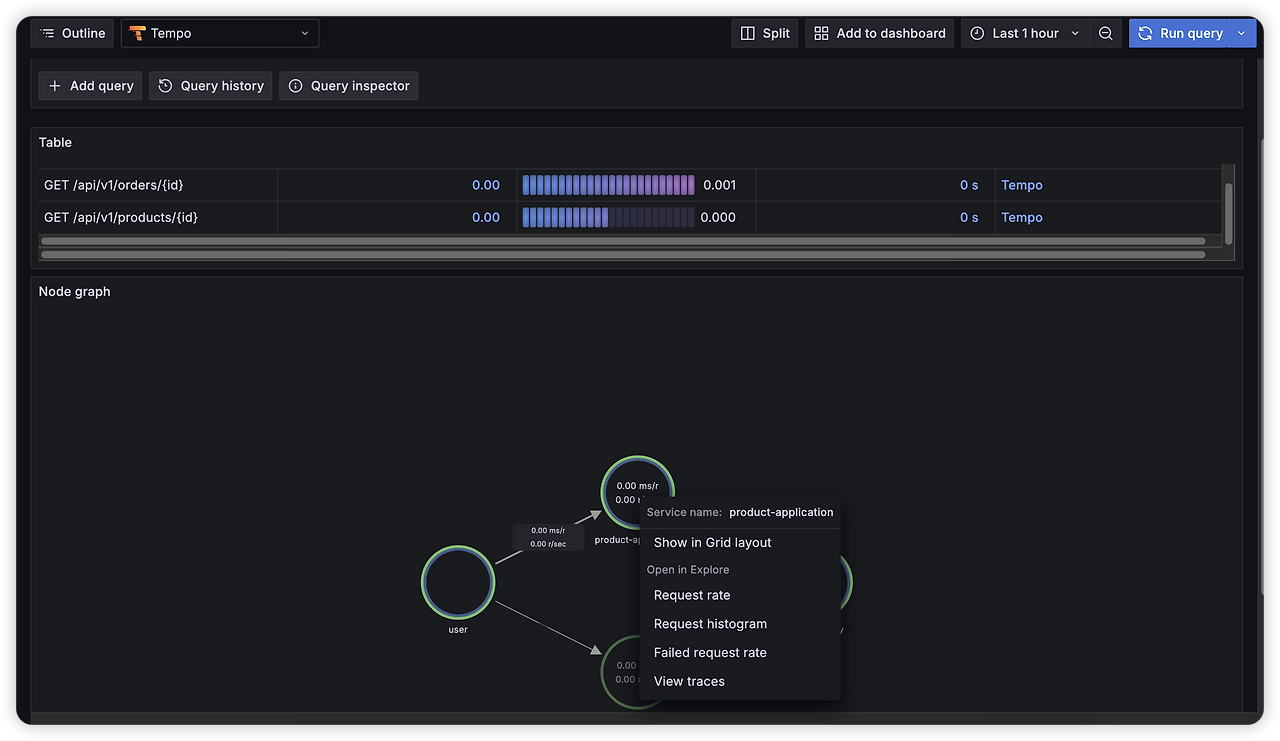
The Service Graph shows which components executed which spans in a connected graph. Clicking the Request rate button links you to the metrics collected during the time period when a particular span occurred.
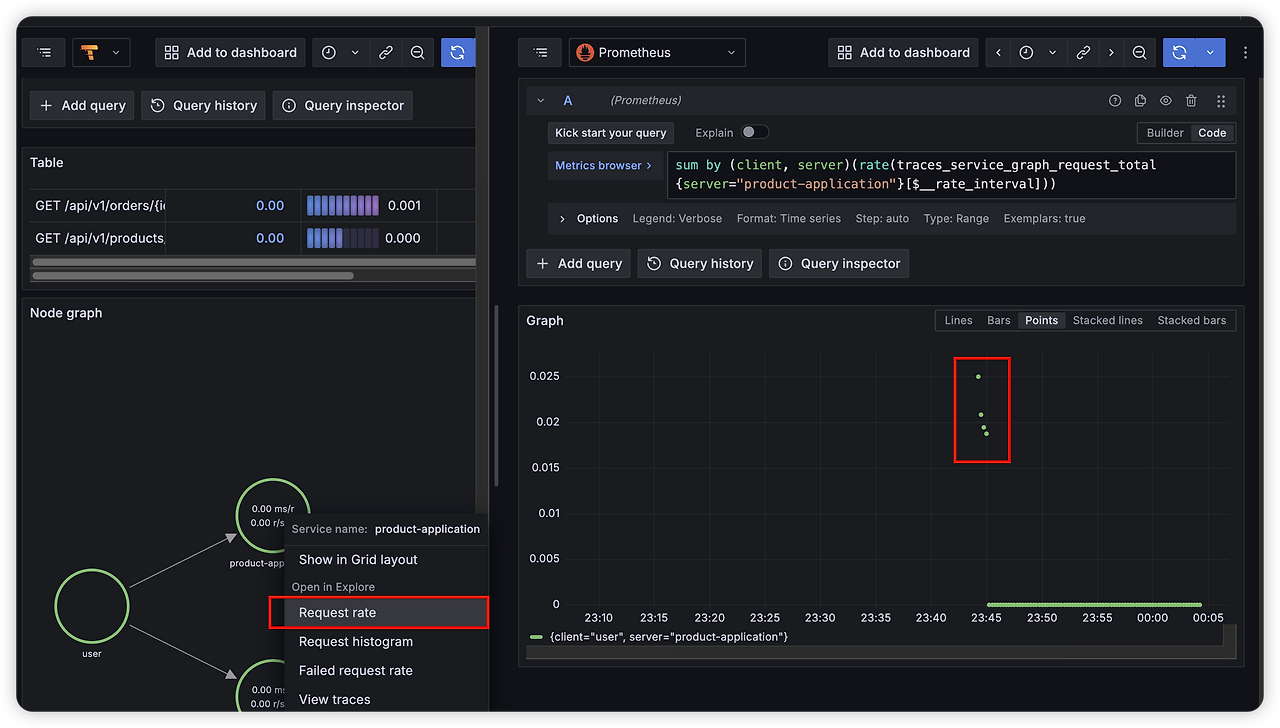
As long as you collect Metric, Trace, and Log data — and store it in a way that supports correlations — Grafana can visualize everything and let you navigate between data types. This enables you to trace what happened and why it happened.
Conclusion
Today we covered the overall concepts of Observability along with practical examples.
I didn’t dive deep into each component, so in a future post I’ll explore how Prometheus, Tempo, and Loki handle data in more detail.
If you now understand what Observability is and why it matters, then this post was a success!